
Code
#install.packages("devtools")
#devtools::install_github("andypicke/rcoagmet")On a recent stormy day in Colorado, I decided to search for what local weather data was available. I came across the CoAgMet network of weather stations, and was excited to see that in addition to some nice web tools and graphics for looking at the data, they also have an data API. I love weather data and working with APIs, so I started writing some R code to access the data. My initial scripts turned into functions, and then I decided to try to develop a package that I could use and share with others: rcoagmet .
I had made a few primitive R packages in the past for personal or internal use, but had never deployed them to github etc.. There are a lot of good resources on creating R packages, and I highly recommend the resource https://r-pkgs.org/ for learning to develop your own R package. The first chapter goes through (almost) the whole process with an example package and following along with that was extremely helpful. The combination of Rstudio and packages like devtools (Wickham et al. 2022) and usethis (Wickham et al. 2024) make package development so much easier (and fun!).
Note that this package is still in active development (I even figured out how to add the nifty Github badge using the lifecycle (Henry and Wickham 2023) package). Please try it out and provide feedback, but know that there could be major changes, so check back often and make sure you have the latest version.
You can install the development version of rcoagmet from GitHub with:
#install.packages("devtools")
#devtools::install_github("andypicke/rcoagmet")The get_coagmet_meta() function retrieves station metadata for CoAgMet stations:
meta <- get_coagmet_meta() # get info for all stations
#meta <- get_coagmet_meta(station_id = 'cht01') # get info for just one station

meta |> DT::datatable(rownames = FALSE)You can also get info for stations in the Northern Water network, by specifying the network parameter:
meta_nw <- rcoagmet::get_coagmet_meta(network = "nw")

meta_nw |>
DT::datatable(rownames = FALSE)The function find_closest_coagmet_station() provides an easy way to find the closest CoAgMet station to a given point.
# coordinates for Denver
xlat <- 39.74
xlon <- -104.99

nearest_station <- find_closest_coagmet_station(xlat, xlon)

nearest_station |> DT::datatable(rownames = FALSE)How do we get the actual weather data? The get_coagmet_data() function returns a cleaned data frame of data for specified station(s) and parameters. This function is actually calls several core functions:
When choosing what parameters to include in the package functions, I tried to find a balance between covering most common tasks while not having to remember or specify too many options. If you want to use a more specific request, you can use the Data API URL builder, and then pass that URL to fetch_coagmet_data_csv().
By default, the get_coagmet_data() function retrieves hourly data (time_step = “hourly”) for the previous 5 days.
df <- rcoagmet::get_coagmet_data(station_id = "den01")

df |>
DT::datatable(rownames = FALSE)We can also get more detailed 5-minute data:
df_5min <- rcoagmet::get_coagmet_data(station_id = "den01", time_step = "5min", date_from = "2024-05-04", date_to = "2024-05-05")

df_5min |>
DT::datatable(rownames = FALSE)latest <- rcoagmet::get_coagmet_data(station_id = "all", time_step = "latest")
latest |>
DT::datatable(rownames = FALSE)Here we get daily data for one station for the month of April:
Note that the daily data has different fields than the hourly, 5min, or latest data.
df_daily <- rcoagmet::get_coagmet_data(time_step = "daily", date_from = "2024-04-01", date_to = "2024-04-30")

df_daily |>
DT::datatable(rownames = FALSE)The package is focused on retrieving the data, but here are a few examples of how you might plot the data.
For time-series data, I like to use the plotly package (Sievert 2020) for R to make an interactive plot that allows me to zoom in/out etc..
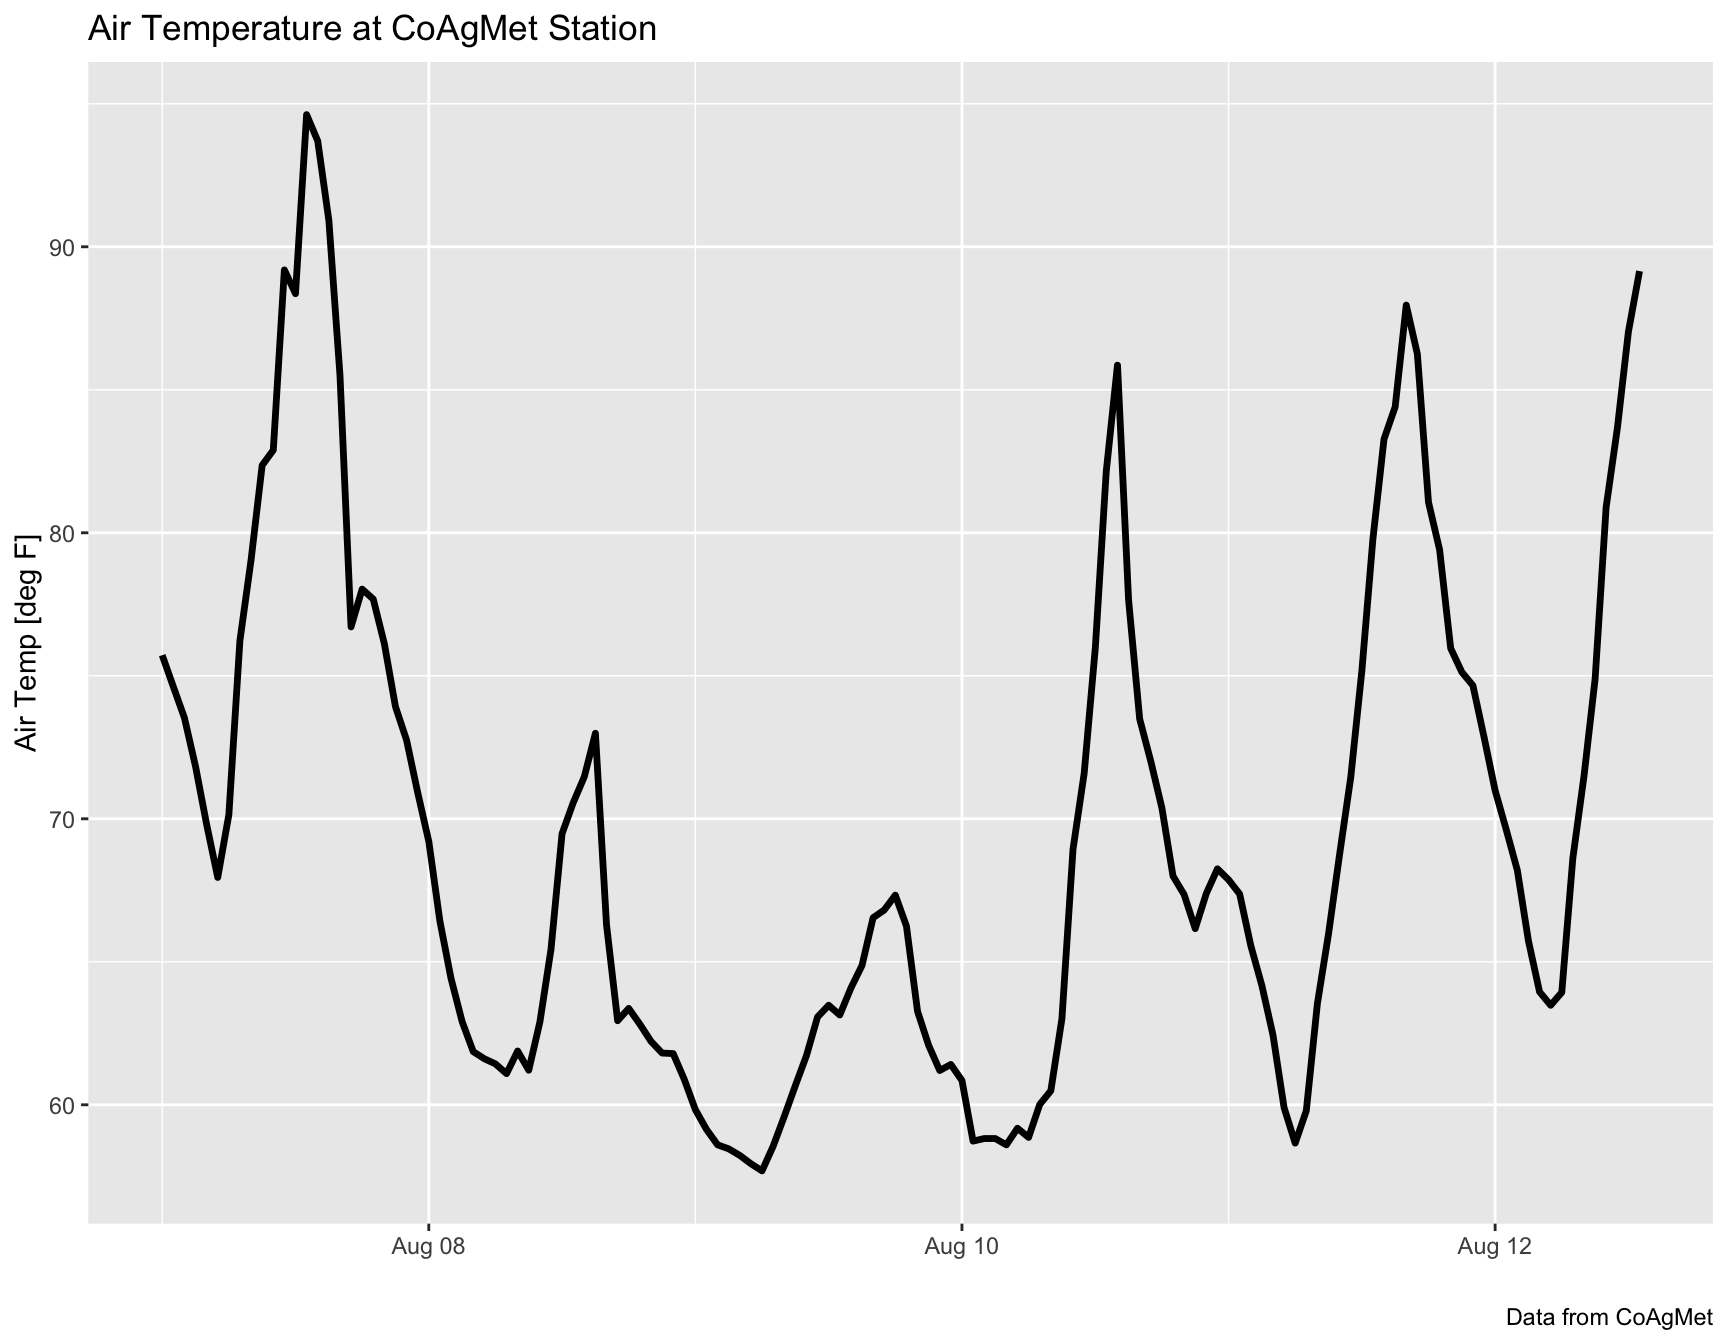
The rcoagmet package also includes a convenience function plot_coagmet_plotly() to make an interactive Plotly figure of one variable
df |> rcoagmet::plot_coagmet_plotly(var_to_plot = "air_temp")Plotly also has a subplot function that makes it easy to plot multiple timeseries and link the x-axes:
p_t <- df |>
  plotly::plot_ly(x = ~date_and_time, y = ~air_temp) |>
  add_lines(name = "Air Temp") |>
  layout(
        xaxis = list(title = "Date"),
        yaxis = list(title = "deg F")
      )

p_rh <- df |>
  plotly::plot_ly(x = ~date_and_time, y = ~rh*100) |>
  add_lines(name = "Rel. Humidity") |>
   layout(
        xaxis = list(title = "Date"),
        yaxis = list(title = "%")
      )

p_w <- df |>
  plotly::plot_ly(x = ~date_and_time, y = ~wind) |>
  add_lines(name = "Wind Speed") |>
   layout(
        xaxis = list(title = "Date"),
        yaxis = list(title = "MPH")
      )

p_precip <- df |>
  plotly::plot_ly(x = ~date_and_time, y = ~precip) |>
  add_bars(name = "Precipitation") |>
  layout(
        xaxis = list(title = "Date"),
        yaxis = list(title = "inches")
      )

plotly::subplot(p_t, p_rh, p_w , p_precip, nrows = 4, shareX = TRUE, titleY = TRUE) |>
layout(title = "CoAgMet Weather Station Data")R version 4.4.1 (2024-06-14)
Platform: x86_64-apple-darwin20
Running under: macOS Sonoma 14.6.1
Matrix products: default
BLAS: /Library/Frameworks/R.framework/Versions/4.4-x86_64/Resources/lib/libRblas.0.dylib
LAPACK: /Library/Frameworks/R.framework/Versions/4.4-x86_64/Resources/lib/libRlapack.dylib; LAPACK version 3.12.0
locale:
[1] en_US.UTF-8/en_US.UTF-8/en_US.UTF-8/C/en_US.UTF-8/en_US.UTF-8
time zone: America/Denver
tzcode source: internal
attached base packages:
[1] stats graphics grDevices datasets utils methods base
other attached packages:
[1] plotly_4.10.4 ggplot2_3.5.1 DT_0.33
[4] rcoagmet_0.0.0.9000
loaded via a namespace (and not attached):
[1] sass_0.4.9 utf8_1.2.4 generics_0.1.3 tidyr_1.3.1
[5] renv_1.0.4 lattice_0.22-6 stringi_1.8.4 hms_1.1.3
[9] digest_0.6.36 magrittr_2.0.3 evaluate_0.24.0 grid_4.4.1
[13] timechange_0.3.0 fastmap_1.2.0 jsonlite_1.8.8 httr_1.4.7
[17] purrr_1.0.2 fansi_1.0.6 crosstalk_1.2.1 viridisLite_0.4.2
[21] scales_1.3.0 jquerylib_0.1.4 lazyeval_0.2.2 cli_3.6.3
[25] rlang_1.1.4 crayon_1.5.3 bit64_4.0.5 munsell_0.5.1
[29] cachem_1.1.0 withr_3.0.1 yaml_2.3.10 tools_4.4.1
[33] parallel_4.4.1 geosphere_1.5-18 tzdb_0.4.0 dplyr_1.1.4
[37] colorspace_2.1-0 curl_5.2.1 vctrs_0.6.5 R6_2.5.1
[41] lifecycle_1.0.4 lubridate_1.9.3 snakecase_0.11.1 stringr_1.5.1
[45] htmlwidgets_1.6.4 bit_4.0.5 vroom_1.6.5 janitor_2.2.0
[49] pkgconfig_2.0.3 bslib_0.8.0 pillar_1.9.0 gtable_0.3.5
[53] Rcpp_1.0.13 data.table_1.15.4 glue_1.7.0 xfun_0.46
[57] tibble_3.2.1 tidyselect_1.2.1 rstudioapi_0.16.0 knitr_1.48
[61] farver_2.1.1 htmltools_0.5.8.1 labeling_0.4.3 rmarkdown_2.27
[65] readr_2.1.5 compiler_4.4.1 sp_2.1-4