# install.packages("devtools")
# devtools::install_github("andypicke/emberr")Introduction
Ember is “an independent energy think tank that aims to accelerate the clean energy transition with data and policy”. I have used some of their data (downloaded as csv files from the website) in a previous post. They recently introduced a new API that makes getting the data even easier, and I decided to develop a R package (emberr) to query and retrieve data from the API.
- You can view the API documentation for more details on the API structure and options.
Tip
If you are interested in learning to develop R packages, I would highly recommend the resource https://r-pkgs.org/ for learning to develop your own R package. Going through the first chapter and following along to create the example package was extremely helpful.
You can install the development version of emberr from GitHub with the install_github() function from the devtools (Wickham et al. 2022) package:
Note
You will need to sign up for a free API key from Ember on the API site. By default, the package functions assume you have stored your API key in your .Renviron file as EMBER_API_KEY. I find the easiest way to do is is to use the edit_r_environ() function from the usethis package (Wickham et al. 2024).
Package Structure
The main function is get_ember_data(), which retrieves the data for specified parameters. This function is actually calling two more basic functions:
- construct_query_url() : Builds the URL for the API query with specfied parameters.
- get_api_request() : Sends the GET request to the API and returns the data.
There is also a function get_ember_options() to get the available options for different parameters. For example, if you want to see the options for the “entity” parameter:
Code
entity_opts <- emberr::get_ember_options(dataset = "electricity-generation",
                                         filter_name = "entity")

head(entity_opts)
[1] "ASEAN" "Afghanistan" "Africa" "Albania"
[5] "Algeria" "American Samoa"
Note
When choosing what parameters to include in the package functions, I tried to find a balance between covering most common tasks while not having to remember or specify too many options. If you want to use a more specific request, you can pass that URL to get_api_request(). I may add some more options as the package develops. See API documentation for available options.
Exampes
To illustrate some features of the package and the data, I decided to show how to use it to answer a few interesting questions:
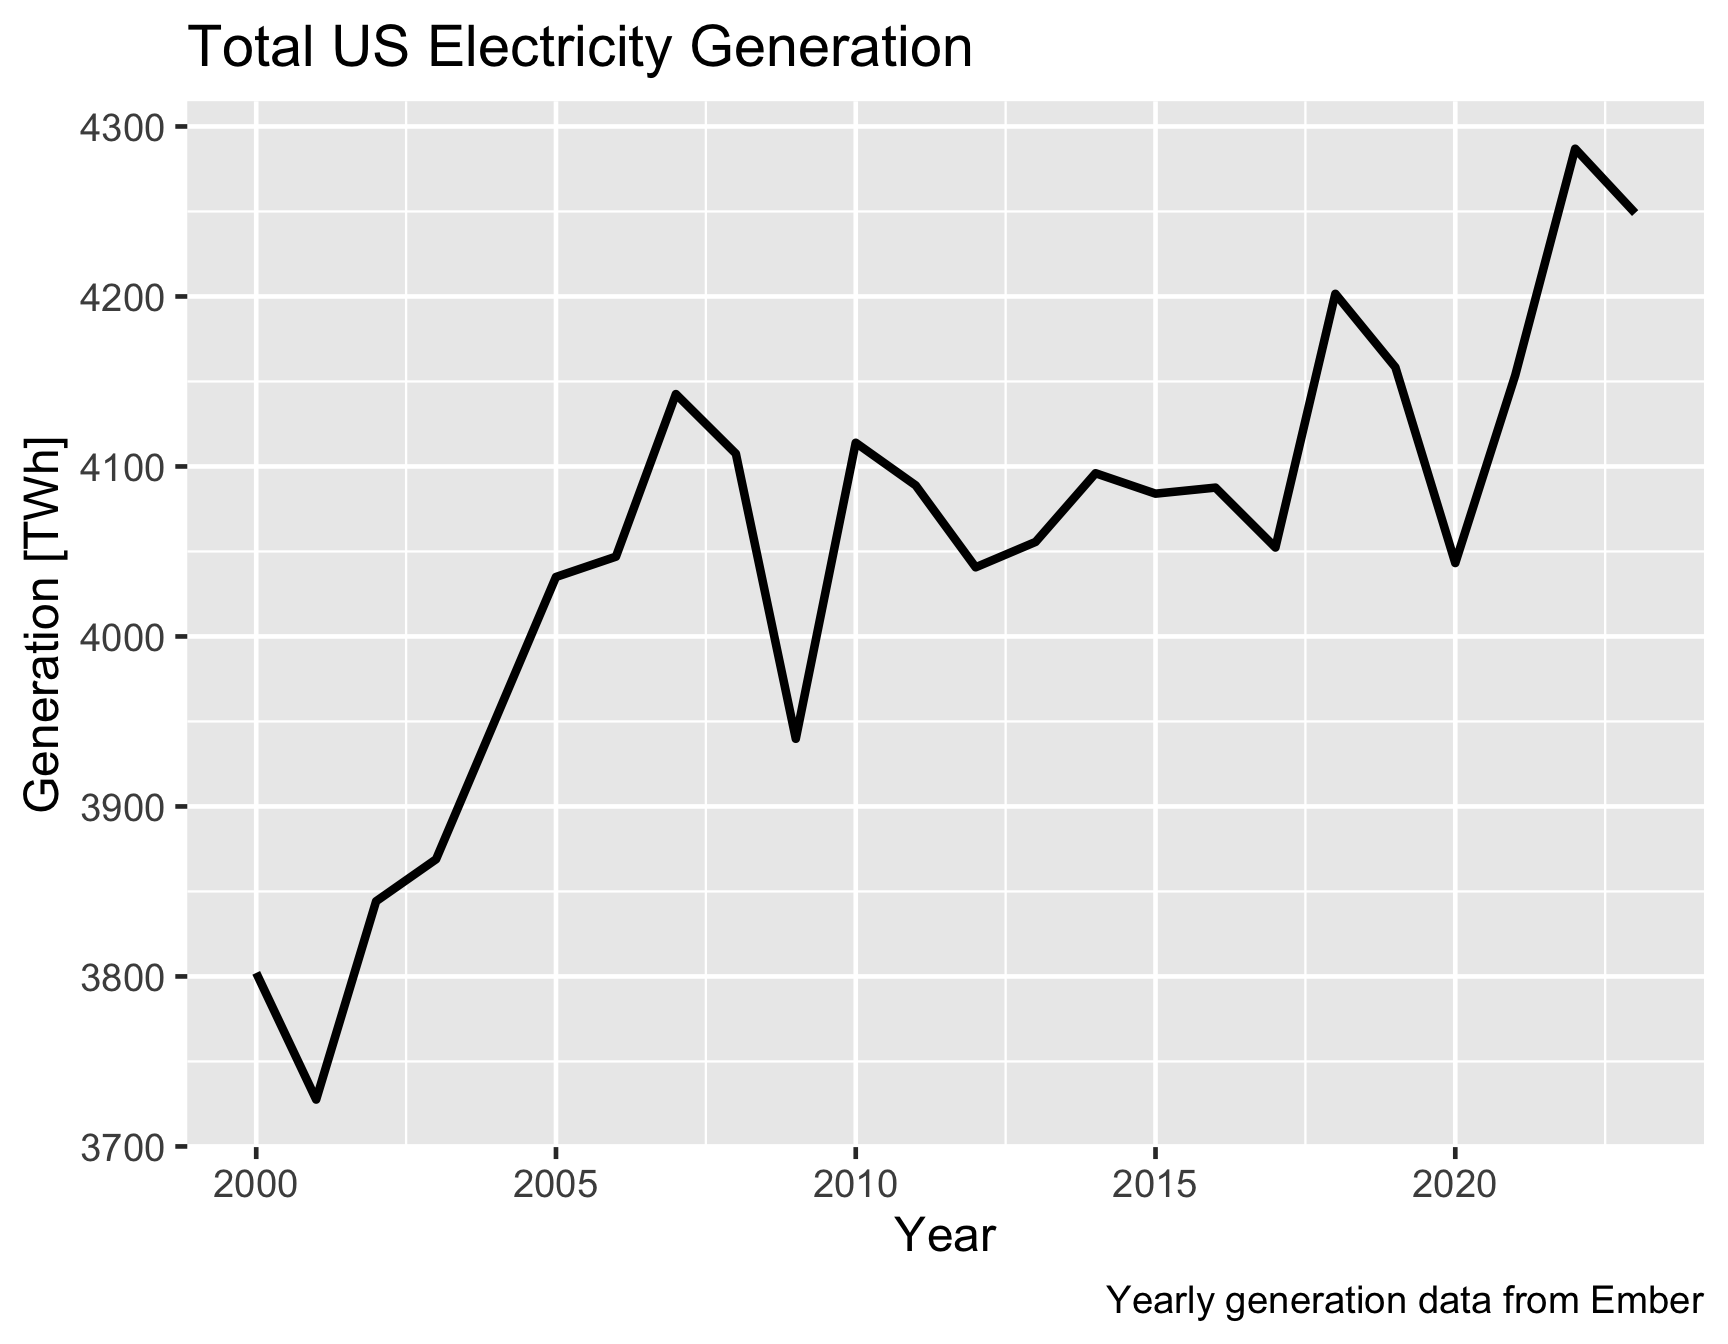
How has US electricity generation evolved over the past ~20 years?
We can download yearly electricity generation data for the US from 2000.
Code
gen_us <- emberr::get_ember_data(dataset = "electricity-generation",
                                 temporal_resolution = "yearly",
                                 min_date = 2000,
                                 entity = "United States")  |>
mutate(year = as.integer(date))

gen_us |>
DT::datatable(rownames = FALSE)Plot Total electricity generation
Code
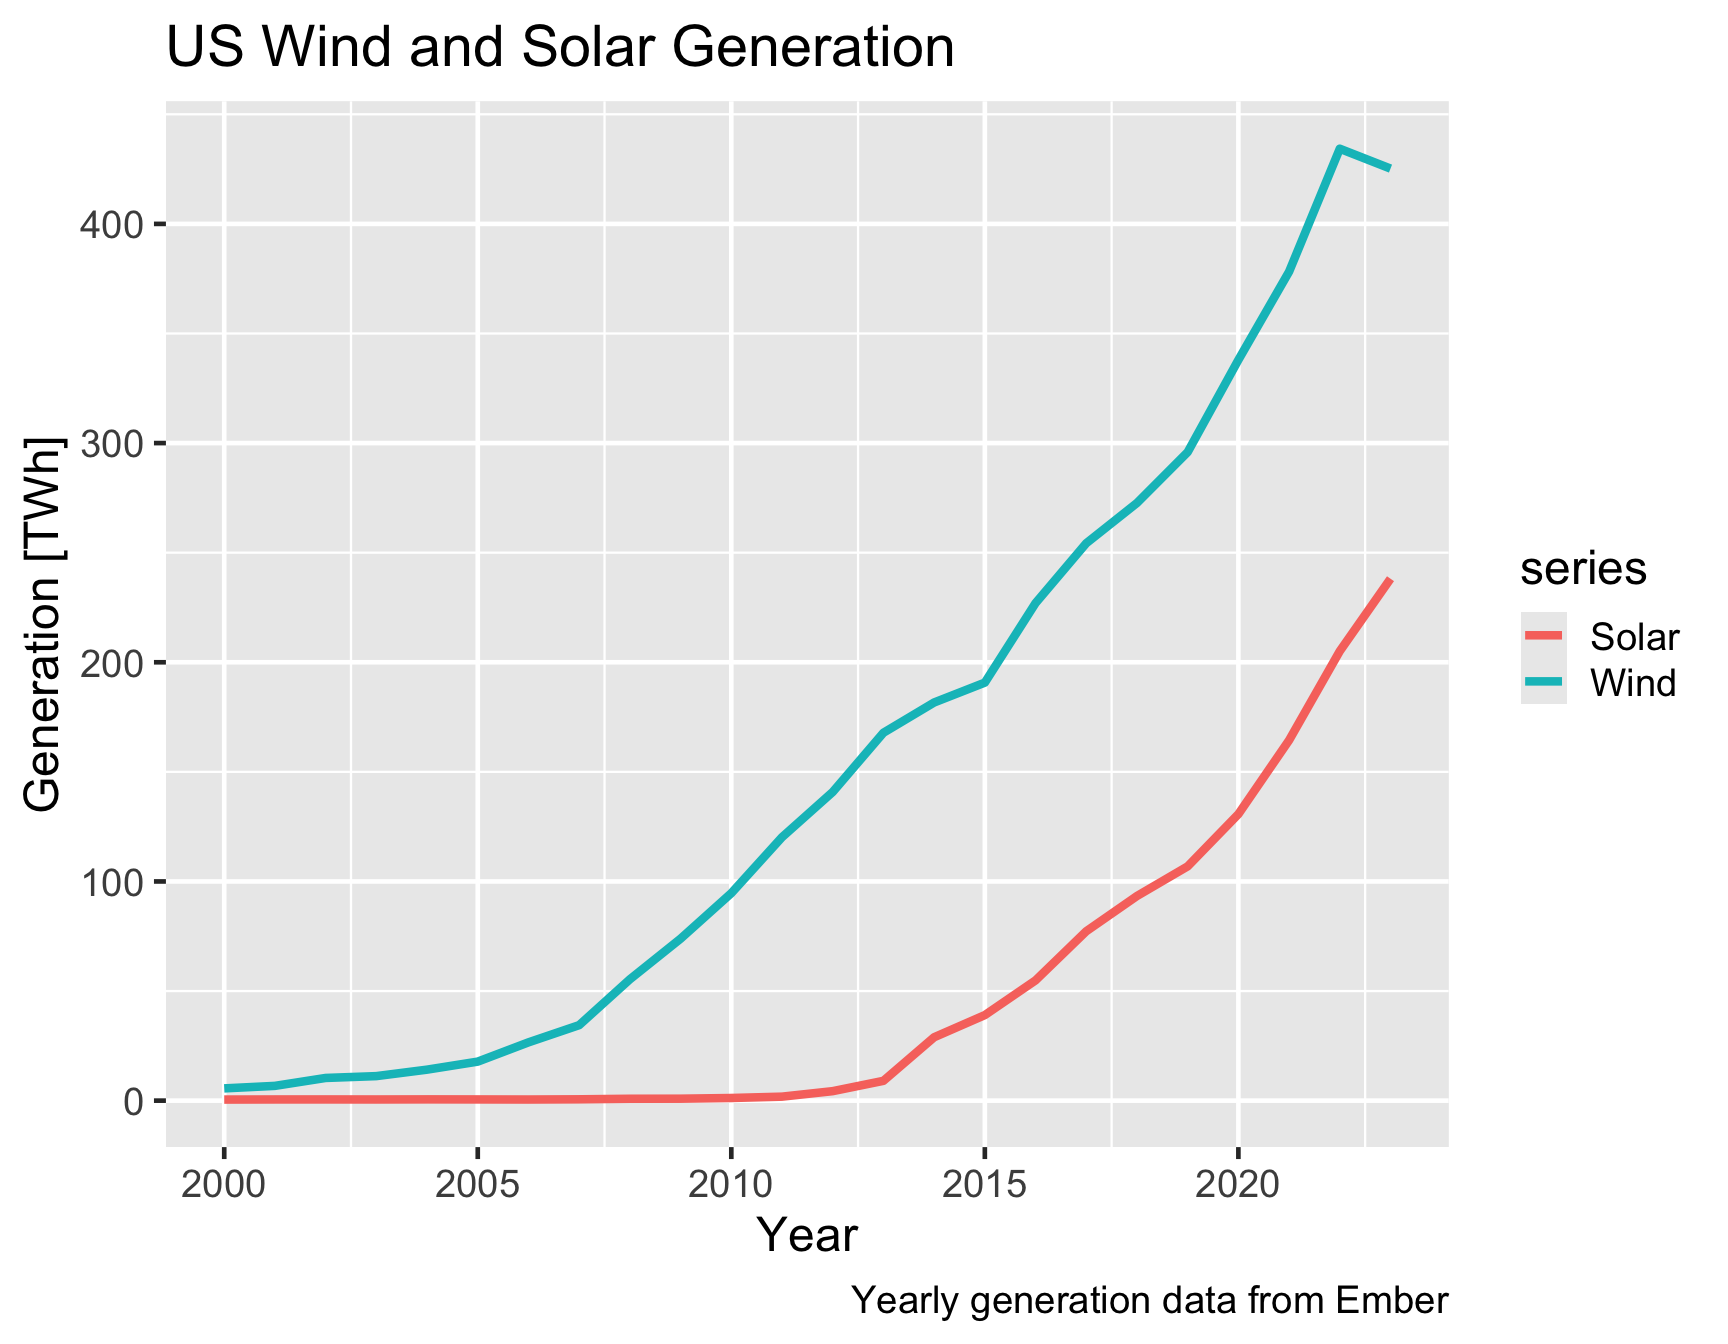
Plot electricity generation from wind and solar
Code
Which countries produced the most electricity from wind power in 2022?
Note that the defaults arguments for get_ember_data() include dataset = “electricity-generation” and temporal_resolution = “yearly”, so don’t actually need to specify them here.
Some of the “entities” are groups of multiple countries (for example Africa or G7). These are indicated with the is_aggregate_entity field in the data, so we can easily filter to include just individual countries.
Code
gen <- emberr::get_ember_data(dataset = "electricity-generation",
                              temporal_resolution = "yearly",
                              min_date = 2022,
                              max_date = 2022)

gen |>
  filter(series == "Wind") |> # filter to only wind generation
  filter(is_aggregate_entity == FALSE) |> # only look at individual countries
  select(entity, date, series, generation_twh, share_of_generation_pct) |>
  arrange(desc(generation_twh)) |>
DT::datatable()Which countries had the most CO2 emissions (from electricity generation) for the year 2022?
For this question we can download the “power-sector-emissions” dataset.
Code
Which countries had the highest carbon intensity in 2022?
The “carbon-intensity” dataset gives CO2 emissions per unit of generation (rather than total emissions). This can be useful when comparing countries with large size or population differences.
Code
Summary
- Ember introduced an API to access their data on global electricity generation and associated CO2 emissions.
- The emberr package (in development) provides a R interface to the API.
- The Ember data can be used to better understand electricity generation, associated carbon emissions, and the clean energy transition.
SessionInfo
Expand for Session Info
R version 4.4.0 (2024-04-24)
Platform: x86_64-apple-darwin20
Running under: macOS Sonoma 14.4.1

Matrix products: default
BLAS:   /Library/Frameworks/R.framework/Versions/4.4-x86_64/Resources/lib/libRblas.0.dylib
LAPACK: /Library/Frameworks/R.framework/Versions/4.4-x86_64/Resources/lib/libRlapack.dylib;  LAPACK version 3.12.0

locale:
[1] en_US.UTF-8/en_US.UTF-8/en_US.UTF-8/C/en_US.UTF-8/en_US.UTF-8

time zone: America/Denver
tzcode source: internal

attached base packages:
[1] stats     graphics  grDevices datasets  utils     methods   base

other attached packages:
 [1] plotly_4.10.4     DT_0.33           lubridate_1.9.3   forcats_1.0.0
 [5] stringr_1.5.1     dplyr_1.1.4       purrr_1.0.2       readr_2.1.5
 [9] tidyr_1.3.1       tibble_3.2.1      ggplot2_3.5.1     tidyverse_2.0.0
[13] emberr_0.0.0.9000

loaded via a namespace (and not attached):
 [1] sass_0.4.9        utf8_1.2.4        generics_0.1.3    renv_1.0.4
 [5] stringi_1.8.4     hms_1.1.3         digest_0.6.35     magrittr_2.0.3
 [9] evaluate_0.23     grid_4.4.0        timechange_0.3.0  fastmap_1.1.1
[13] jsonlite_1.8.8    httr_1.4.7        fansi_1.0.6       crosstalk_1.2.1
[17] viridisLite_0.4.2 scales_1.3.0      jquerylib_0.1.4   lazyeval_0.2.2
[21] cli_3.6.2         rlang_1.1.3       munsell_0.5.1     cachem_1.0.8
[25] withr_3.0.0       yaml_2.3.8        tools_4.4.0       tzdb_0.4.0
[29] colorspace_2.1-0  curl_5.2.1        vctrs_0.6.5       R6_2.5.1
[33] lifecycle_1.0.4   htmlwidgets_1.6.4 pkgconfig_2.0.3   pillar_1.9.0
[37] bslib_0.7.0       gtable_0.3.5      glue_1.7.0        data.table_1.15.4
[41] xfun_0.43         tidyselect_1.2.1  rstudioapi_0.16.0 knitr_1.46
[45] farver_2.1.1      htmltools_0.5.8.1 labeling_0.4.3    rmarkdown_2.26
[49] compiler_4.4.0
References
Wickham, Hadley, Jennifer Bryan, Malcolm Barrett, and Andy Teucher. 2024. “Usethis: Automate Package and Project Setup.” https://CRAN.R-project.org/package=usethis.
Wickham, Hadley, Jim Hester, Winston Chang, and Jennifer Bryan. 2022. “Devtools: Tools to Make Developing r Packages Easier.” https://CRAN.R-project.org/package=devtools.